JetBrains Rider
JetBrains Rider is a commercial JetBrains IDE for C# and C++ that uses the same solution system as Visual Studio.
Note
This documentation is for contributions to the game engine, and not using JetBrains Rider as a C# or GDScript editor. To code C# or GDScript in an external editor, see the C# guide to configure an external editor.
Importing the project
You will need to install Python in your development environment along with MinGW. You will also need the Visual Studio C++ Build Tools, which you can install using the Visual Studio Installer. Ensure all dependencies are installed before you continue to the next steps.
Tip
If you already use Visual Studio as your main IDE, you can use the same solution file in Rider. Rider and Visual Studio use the same solution format, so you can switch between the two IDEs without rebuilding the solution file. Debug configurations need to be changed when going from one IDE to another.
Rider requires a solution file to work on a C++ project. While Blazium does not come with a solution file, it can be generated using SCons.
Navigate to the Blazium root folder and open a Command Prompt or PowerShell window.
Copy, paste and run the next command to generate the solution.
scons platform=windows vsproj=yes dev_build=yes
The vsproj parameter signals that you want Visual Studio solution generated.
The dev_build parameter makes sure the debug symbols are included, allowing to e.g. step through code using breakpoints.
If you have Rider setup as your main IDE for .sln, you can now open the project by double-clicking on the
blazium.slnin the project root or by using the Open option inside of Rider.
Note
Rider could fail to build the solution. If that is the case, try running git clean -xdf to remove all traces of the previous build artifacts and regenerate the build files using the scons command again. Restarting the terminal and your development environment may help.
Compiling and debugging the project
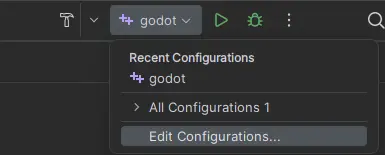
Rider comes with a built-in debugger that can be used to debug the Blazium project. You can launch the debugger by pressing the Debug icon at the top of the screen, this only works for the Project manager, if you want to debug the editor, you need to configure the debugger first.

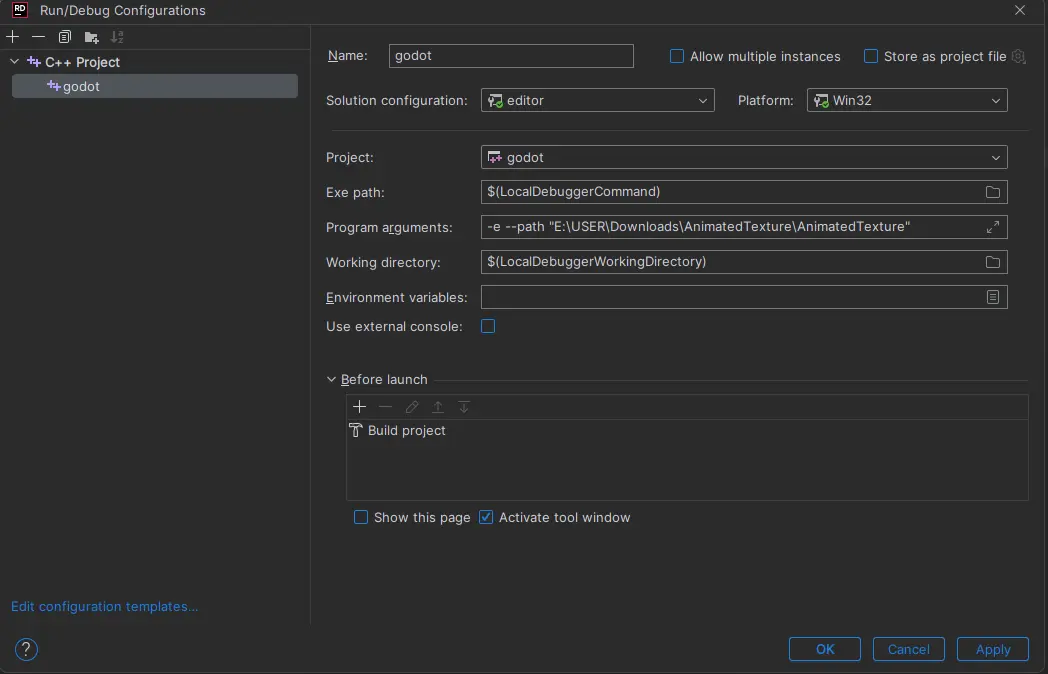
Click on the Blazium > Edit Configurations option at the top of the screen.

Ensure the following values for the C++ Project Run Configuration:
Exe Path :
$(LocalDebuggerCommand)Program Arguments:
-e --path <path to the Blazium project>Working Directory:
$(LocalDebuggerWorkingDirectory)Before Launch has a value of "Build Project"
This will tell the executable to debug the specified project without using the project manager.
Use the root path to the project folder, not project.godot file path.

Finally click on "Apply" and "OK" to save the changes.
When you press the Debug icon at the top of the screen, JetBrains Rider will launch the Godot editor with the debugger attached.
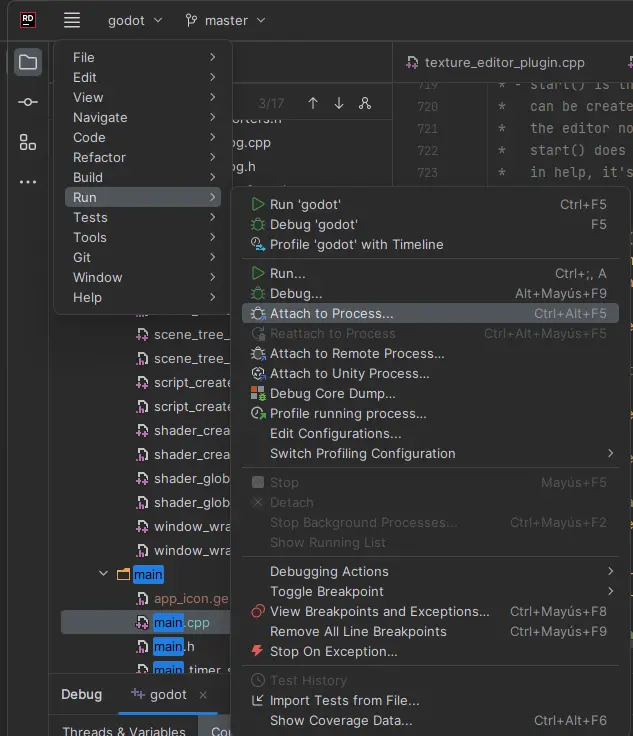
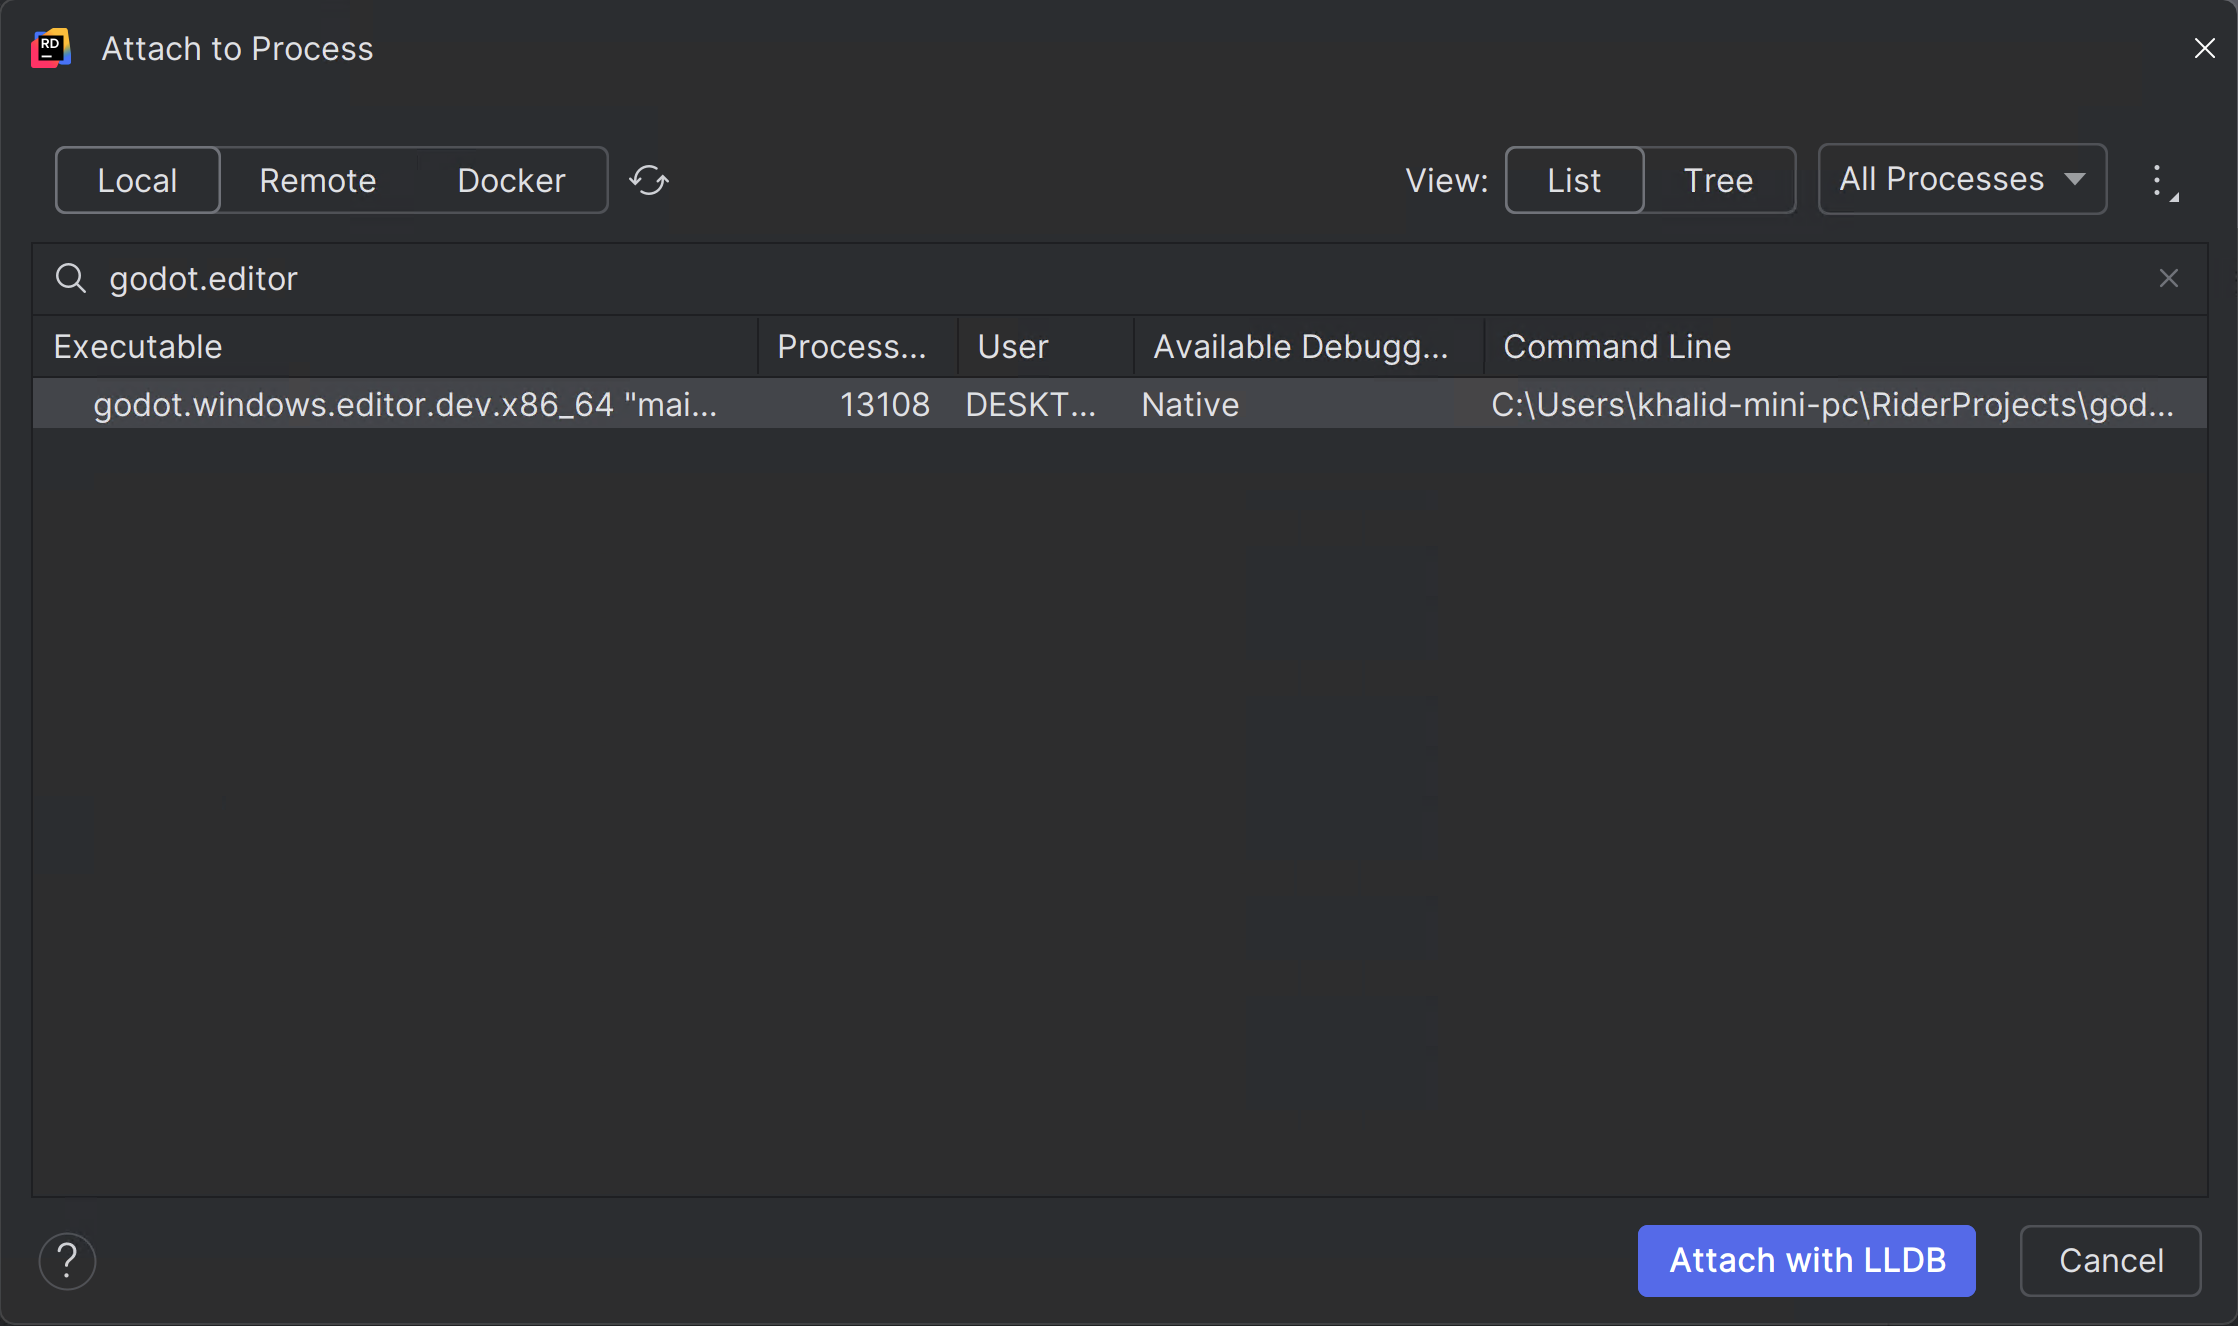
Alternatively you can use Run > Attach to Process to attach the debugger to a running Blazium instance.

You can find the Godot instance by searching for
godot.editorand then clickingAttach with LLDB

Please consult the JetBrains Rider documentation for any specific information about the JetBrains IDE.